
Friday, October 14, 2011
Wednesday, October 5, 2011
Cadence and synchronization
Week ago I've finished an excellent book from Don Reinertsen and since then I cannot stop thinking about cadence and synchronization.
Two simple elements.
Analogy: traffic lights.
Cadence
Imagine what would happen if traffic lights were not predictable. Nobody knows when comes next green. What would you do? Some people would slow down on yellow, some would go on red. Chaos. People would start to look for longer alternative, but predictable ways. New source of variance ...
 Something similar happens with big products - nobody can predict next release. All are focused to finish actually running one. Some people try to slow down to have it finally finished, some pushes to have "this horrible bug" solved. Or extremely important end-user feature must be in. Many companies, however, already realized the power of cadence: e.g. linux www.ubuntu.com is released every six months. Rock solid for years already. Predictable. Did not your favorite feature managed to get into the release? No panic, no stress, no pressure - in half a year it's in.
Synchronization
Everybody knows this terrible feeling having in one line four times red signal. Solution is simple: green wave.
Development of big products is similar: try to personalize features. How do they feel when after successful passing the design phase they must wait on red signal for weeks to pass through and wait again for weeks to be integrated and again to be tested and again to take over.
Two simple elements: cadence and synchronization.
Friday, September 30, 2011
Neuschwanstein Castle - Lean paradies, part 2
And here another set of my observations after few days off. In between I could participate on great conference ALE 2011 in Berlin - some insights come later.
- Ticket is bound to specific tour
Clever. This aspect decreases the variance and thus subjective value for visitors. On other side a lot of conflicts can be avoided this way (assignment to certain tour takes place already when buying ticket)
- The number of tourists in one batch/tour is limited
Simple rule to decrease variance and thus increase predictability. Whole tour is then optimized to this number in one batch.
- You cannot buy ticket for a tour that is already sold out
Relevant to previous point - however it says that information about maximum and actual batch size is available already on ticket counter.
- In front of the tour entrance you can find people in three queues
- prepared as one batch (5 minutes to start)
- finishing the collection of the group for tour (10 minutes to start)
- just opened queue (15 minutes to start)
- the rest of visitors is waiting around until their tour is next to be collected in waiting queue
- Enter to the tour queue is automated based on the ticket (to minimize transaction costs)
- Last stage in the tour is without explicit guide - The guider is already on the way to next group that is in-between collected in the first room of the castle
- No tourist gadgets can be found in the entrance area - these are side artifacts that could influence the throughput
- During the tour you can hear small bell. I am not sure, but I suspect that this is a synchronization signal for all tours inside the castle. Every guider gets a feedback if his group is too slow or in opposite - should slow down. This keeps the process cadence stable during the whole day.
- Whole capacity is not used on 100% to keep the overall throughput on maximal level. (See Allen-Cunneen Approximation for queue length and resulting process performance as consequence of Little's Formula)
- And results?
- People are happy as service is excellent
- More than 1.3 million people visit annually, with up to 6,000 per day in the summer. This means up 10 hours every five minutes one batch with 25 people, with very small buffer for unpredictable events. Wow.
Wednesday, August 31, 2011
Neuschwanstein Castle - Lean paradies, part 1
Recently I had the chance to visit castle Neuschwanstein. And surprise: beside not discussable cultural value I could observe many lean practices.
I cannot comment if all of them were implemented on purpose and under the Lean umbrella - I have not noticed explicit lean logos as we know it from Toyota.
To save some words here is the inventory of my observations:
- Ticket sale service is in separate building – not in front of castle entrance
- This is queue content optimization pure :). It provides the flexibility to re-organize content of the big queue so people are approaching the castle itself in already given order (sure with some variance – respecting individual needs)
- Ticket sale service is equipped with lines for people queue
- This technique is well known and can be often seen on airports when waiting for check-in. This tool ensures that incoming order is clear and predictable. A lot of conflicts can be avoided.

- The length of people queue is configurable in ticket sale service. People queue itself is very effective, but it could slow down throughput if the installed length does not correlate with real needs.
- One queue - many ticket counters. This way, in this case, is more effective than the other alternative: every ticket counter has separated waiting queue (can be seen in supermarkets).
- One can increase the performance of this process step (selling tickets) without need to reconfigure the queue itself.
- Ticket counter that unplanned stops working does not increase blood pressure of 20 people waiting exactly in this queue. Both this properties are very valuable in high
- Tours are guided only
- This is core element, means whole process is under certain tact, cadence.
Tuesday, July 26, 2011
Impact of visualization on the self-organizing system
In self-organization systems/teams, visualization plays an important role. Consider next graphic expressing the definition of project structure.

In the project organization structure two extremes can be observed: chaos or command and control.
Chaos in project can be seen, e.g. if team structure is not clear, every co-worker is (maybe) working on topics he founds important. This leads to local optimizations on different levels. The probability to succeed in this structure is very low as can be often seen already by first integration of outputs.
The other extreme is the “Command and control” approach were single person – typically technically very strong – is driving every single change personally. He gives orders and on regular manner checks the progress, takes countermeasures if necessary, etc.
Within scrum – what we want to achieve – is such level of self-organization, that pros from both extremes are in place and if possible cons are eliminated. Visualization can help establish so-called center of gravity – a motivation point – attracting people and driving them as a team towards common goal. It is the common goal that drives self-organizing group to the right direction and help them consistently work to achieve results.
As only very small portion of available information can be physically visualized, people are very instinctively attracted.
Similar effect can be caused or is supported by good vision.
Friday, May 27, 2011
Role of visualization in SW development
Development department can be seen as a system with certain inputs and outputs. As input we could consider market needs, or product specification, depends on abstraction level to be considered. The output is then either profit or product with certain attributes.
Nowadays, nobody would question that this system is very complex, processes running inside it are stochastic and exact description is impossible to achieve.
Independently on the system complexity, control theory points to a feedback as to the central role in order to achieve good and fast results. The output of process step is sampled and summed with required value. It is then put back to the system so behavior can be adapted to reach required value – in our case faster.
In product and especially in software development process the output is often information – market needs, requirement specification, test specification, architecture, and SW modules.
Such output is not visible per default and if visible, then only to small number of people – actuators cannot access it in a non limited way. Same is valid for intermediate information created within the process. This fact causes that feedback signal is either not in place at all, is very low or noisy.
From this point of view any attempt to visualize information has dramatic positive impact on the system – development process.And not to forget: missing feedback loop - lost opportunities for learning.
Friday, April 15, 2011
Why it is hard to succeed as senior project manager
Imagine typical large company. Typical carrier path. You are young, perspective, you are excellent at maintaining relationships with your colleagues. You are directly participating in the actual work, changing code, writing tests, integrating. Sure blocked by many bad decisions from your management, but still positive about future, enthusiastic in solving these obstacles. Now, after years, you have gathered a lot of experience, you know what is the right solution for your organization and good message comes: your company has realized that you are the one and you got promoted. Time goes on, year after year: promoted and again and once again...
Suddenly you are in the position of senior project manager, taking all these "suboptimal decisions". Why? What went again wrong?
Conclusion of our small discussion in the team: as you are young and perspective, there is nearly no power in your hands to change something or to make decisions that would lead to bigger improvements. After years and many promotions you got the power, possibilities. But typical project manager either
Fortunately, there are real live examples how some companies deal with this problem. E.g. every employee has directly contribute to the customer value with at least 20%, or every manager has to spend weekly four hours with developers in the same office.
Have you also observed similar pattern in your environment?
Suddenly you are in the position of senior project manager, taking all these "suboptimal decisions". Why? What went again wrong?
Conclusion of our small discussion in the team: as you are young and perspective, there is nearly no power in your hands to change something or to make decisions that would lead to bigger improvements. After years and many promotions you got the power, possibilities. But typical project manager either
- forget about issues that he was experiencing many years ago,
- or situation was radically changed (people, problems, domain, technology),
- or in most cases both
Fortunately, there are real live examples how some companies deal with this problem. E.g. every employee has directly contribute to the customer value with at least 20%, or every manager has to spend weekly four hours with developers in the same office.
Have you also observed similar pattern in your environment?
Tuesday, March 29, 2011
Configuration management story - part 3
Setup described in this story was reached after four years of development in heavy process based project.
How was this achieved:
- Bringup tests were automated in a sustainable manner, i.e. the effort to keep them actual is affordable. It is not like team would not try to automate tests before – but several factors like technology or experience have killed this try.
- Teams have given up in negotiations with “CM responsible” and created a tool chain with significantly better performance.
- Number of builds (or integrations) was increased from two per week to more than 100 ((6*4+2)*5 + 2) [(6 teams 4 times a day + 2 common) 5 times a week + 2 regular builds = 132]
- Number of builds that can be daily executed gave the possibility to optimize the CM structure and adapt according to system dynamics.
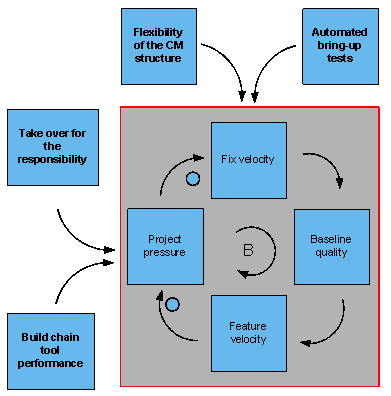
The simplified schematic of actual structure is on next picture:

One morning we have discussed with the team how has the build structure evolved. Consensus that we came to: whole story is nice demonstration of general self-organizing system behavior, if the system detects an obstacle. In this case, we have developed complete CM solution outside our CM department and CM build as was known in previous versions is just last formal step right now. This points to the weak management as well – we were not able to improve most inflexible and obviously slowing down ring of our development chain.
And finally once again causal loop diagram:
Wednesday, February 16, 2011
Configuration management story - part 2
This story is very short. Nevertheless the improvement helped the project to survive and converge on the final delivery.
After many months of pain and stress, it was decided to perform so-called bring-up test (or smoke test etc). This was supposed to be executed after every build, with some rules to be applied:
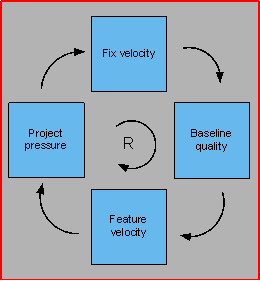
Episode 2: How bring-up test execution stabilized negative feedback loop of bad quality.
As every change also this one came with certain resistance. In these times the typical discussion was moving around resources. Who is supposed to perform tests? Do we get more people, or shall we cut some of our tasks? We won't be able to finish our previous tasks on time if we have to execute these tests...etc
The process was finally established with the help of power, time and positive feedback loop.


After many months of pain and stress, it was decided to perform so-called bring-up test (or smoke test etc). This was supposed to be executed after every build, with some rules to be applied:
- If bring-up of local build fails then it is not allowed to submit labels to common build
- If bring-up of common build fails - whole development team is informed and baseline is marked as unstable thus not usable. In this case, fix build was scheduled with only few labels solving the issue.
Episode 2: How bring-up test execution stabilized negative feedback loop of bad quality.
As every change also this one came with certain resistance. In these times the typical discussion was moving around resources. Who is supposed to perform tests? Do we get more people, or shall we cut some of our tasks? We won't be able to finish our previous tasks on time if we have to execute these tests...etc
The process was finally established with the help of power, time and positive feedback loop.
Whole effect can be now described in few sentences:
- As tests were executed by particular teams itself - it got the power and thus also the responsibility to judge if quality is sufficient or not
- Increased awareness of possible negative side-effects has stressed testing before change is submitted.
- The "fix velocity" was increased by fast feedback - in fact the test result was known just few hours after label submission (however still only twice a week)

Picture above shows the entire process. The small picture below shows then main consequence - bring-up tests stabilized, before negative, reinforcement loop.

Friday, January 7, 2011
Configuration management story - part 1
In next days I'd like to write down our CM story. How a CM process has changed over the last years in our organization and project.
Once upon a time - before has the project really started - few people wrote a configuration management plan. All the experience was written down and reviewed until all participants were tired of reviewing. That was a trigger to consider the plan as final version and document was successfully released under complex process.
CM process itself was pretty simple. Three groups of developers were defined: two of them distributed and local one. Every supplier was supposed to submit their changes to the local build once a week. Together with changes from local team all changes were submitted to the common build. This was then next day used as a new baseline for further development.
Episode 1: How CM process contributes to the dependency between feature velocity and baseline quality.
Picture below shows the causal loop diagram [1], [2]. The term “build quality” should be interpreted as stability expressed e.g. in number of exceptions per hour…

- As every developer submits his changes to the local build without the integration and testing of unwanted side effects the quality of local build goes down.
- Local build result is submitted to the common baseline which goes consequently also down.
- Decreased baseline quality has bad influence on the development velocity on both constructions: featured development and also the bug fixing.
- The lower is feature velocity the higher project pressure is created by management.
- This makes the developers morale low but also decreases the bug fixing rate, while developer will rather decide to implement new feature as to fix reported bug.
- Low bug fixing rate decreases again the baseline quality etc…
Consequence of this is a reinforcing loop depicted in the red box.

With some delay a process change came introducing so called bring-up tests. And the story continues with the episode 2.
With some delay a process change came introducing so called bring-up tests. And the story continues with the episode 2.
Reference:
Subscribe to:
Posts (Atom)